Here are some stats compilation before the LCS semifinals. Stats are from Summer Split regular season (quarterfinals are not included) and comes from www.gamesoflegends.com.
This article follow the previous one about quarterfinals : LCS Playoffs quarterfinals teams’ stats compilation
Page 1: Origen vs H2K
Page 2: CLG vs TiP
Page 3: Fnatic vs UoL
Page 4: Team Liquid vs TSM
Origen vs H2K Gaming
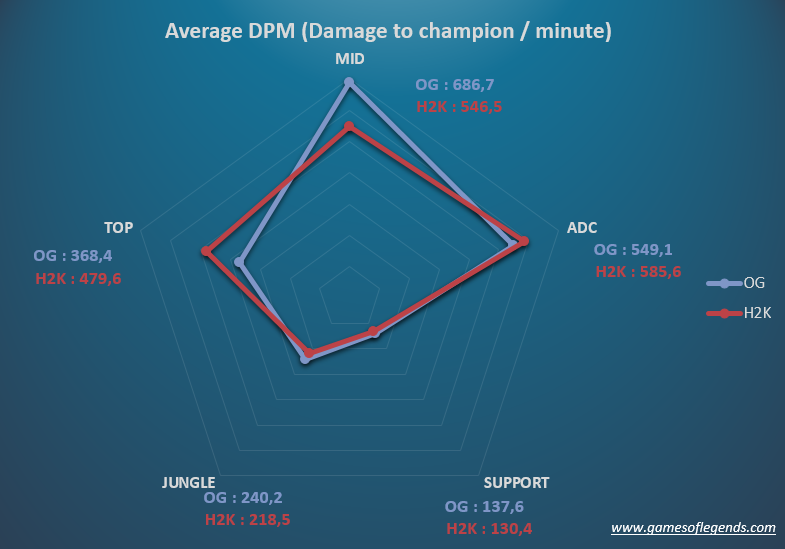
Damage profile

Stats
| Origen | H2K Gaming | EU average | |
| Winrate % | 67 | 61 | |
| Avg game duration | 36:50 | 36:25 | 37:45 |
| Gold / minute | 1701 | 1674 | 1621 |
| Objectives Control | |||
| Dragons / game | 2.7 | 2.3 | 2.18 |
| Dragons % | 65.7 | 55.5 | |
| Nashors / game | 1.1 | 0.6 | 0.77 |
| Nashor % | 69.4 | 51.9 | |
| Towers killed / lost | 1.58 | 1.54 | 1.24 |
| Kill Potential | |||
| First blood % | 55.6 | 61.1 | |
| KDA | 5 | 4.4 | 3.66 |
| Kills / game | 16.1 | 16 | 13.4 |
| Kills / deaths ratio | 1.47 | 1.32 | 1.06 |
| Farming | |||
| cs / minute | 27.69 | 26.7 | 27.45 |
| Vision Control | |||
| wards / minute | 3.08 | 2.9 | 2.97 |
| % of wards cleared | 31.46 | 28.25 | 29.53 |
During Summer Split, Origen won 2 times against H2K. The last game between the 2 teams was kind of a close game. Origen pushing his advantage of a 40min nashor badly protected by H2K. Here is the Gold graph of the last game (H2K are blue, OG are red) :
 (graph from www.lolesports.com)
With H2K good performance in quarterfinals and the scenario of their last opposition, I think we can expect some close game between the 2 teams. Still, Origen looks favorite.
CLG vs Team Impulse
Damage profile

Stats
| CLG | TiP | NA average | |
| Winrate % | 68 | 68 | |
| Avg game duration | 37:01 | 37:07 | 38:55 |
| Gold / minute | 1702 | 1776 | 1616 |
| Objectives Control | |||
| Dragons / game | 2.4 | 2.5 | 2.24 |
| Dragons % | 56.7 | 58.2 | |
| Nashors / game | 0.9 | 1.1 | 0.8 |
| Nashor % | 64.9 | 73.7 | |
| Towers killed / lost | 1.49 | 1.43 | 1.06 |
| Kill Potential | |||
| First blood % | 68.4 | 57.9 | |
| KDA | 4.6 | 5.6 | 3.79 |
| Kills / game | 16.4 | 17.9 | 13.89 |
| Kils / deaths ratio | 1.3 | 1.49 | 1.04 |
| Farming | |||
| cs / minute | 27.41 | 28.2 | 27.23 |
| Vision Control | |||
| wards / minute | 2.8 | 3.26 | 3.03 |
| % of wards cleared | 37.27 | 32.59 | 33.50 |
The score between the 2 teams in Summer Split was 1-1, TiP winning the last one.
Interesting fact about CLG vision control, they have the worst WPM of NA LCS, but they have the best WC%, clearing 37.2% of opponent’s wards.
Fnatic vs UoL
Damage profile

Well, it’s difficult to draw any conclusion from Fnatic’s perfect split stats. They have shown us every lane can carry a game, and we can see that on their damage chart.
Stats
| Fnatic | UoL | EU average | |
| Winrate % | 100 | 50 | |
| Avg game duration | 36:10 | 36.04 | 37:45 |
| Gold / minute | 1866 | 1571 | 1621 |
| Objectives Control | |||
| Dragons / game | 2.8 | 2.2 | 2.18 |
| Dragons % | 66.7 | 52.7 | |
| Nashors / game | 1.5 | 0.4 | 0.77 |
| Nashor % | 88.9 | 41.2 | |
| Towers killed / lost | 2.42 | 0.93 | 1.24 |
| Kill Potential | |||
| First blood % | 66.7 | 50 | |
| KDA | 7.2 | 3.4 | 3.66 |
| Kills / game | 18.4 | 12.6 | 13.4 |
| Kills / deaths ratio | 2.15 | 0.91 | 1.06 |
| Farming | |||
| cs / minute | 30.37 | 25.6 | 27.45 |
| Vision Control | |||
| wards / minute | 3.25 | 2.93 | 2.97 |
| % of wards cleared | 32.65 | 29.33 | 29.53 |
During their last game, despite UoL getting the first blood and putting down Huni’s Ryze at 0/2, they didn’t manage to control him.
Team Liquid vs TSM
Damage profile

I already wrote before about TSM’s damage being mid-centric, but they have shown us during quarterfinals that they can adapt their playstyle and champion pool. During quarterfinals, Bjergsen played Lulu (first time this season) and Orianna, playing a more supportive role, and his damage share went down to 30% from 42.5% during the regular season. Maybe it was just an anti-Gravity strategy, but I’m looking forwards their picks versus Team Liquid.
Regarding Team Liquid’s damage, and specifically mid lane, Fenix didn’t played poke champion a lot (only Jayce 2 times), so considering is champion pool, his DPM is quite good.
Stats
| TL | TSM | NA average | |
| Winrate % | 74 | 61 | |
| Avg game duration | 40:06 | 42:25 | 38:55 |
| Gold / minute | 1699 | 1621 | 1616 |
| Objectives Control | |||
| Dragons / game | 2.6 | 2.6 | 2.24 |
| Dragons % | 60 | 53.9 | |
| Nashors / game | 1.4 | 0.8 | 0.8 |
| Nashor % | 77.2 | 46.3 | |
| Towers killed / lost | 1.64 | 1.36 | 1.06 |
| Kill Potential | |||
| First blood % | 52.6 | 38.9 | |
| KDA | 5.7 | 4.4 | 3.79 |
| Kills / game | 16.2 | 13.7 | 13.89 |
| Kills / deaths ratio | 1.52 | 1.23 | 1.04 |
| Farming | |||
| cs / minute | 27.55 | 27.6 | 27.23 |
| Vision Control | |||
| wards / minute | 2.96 | 3.1 | 3.03 |
| % of wards cleared | 33.39 | 35.79 | 33.5 |
Others stats worth noticing for Team Liquid :
- Fenix’s Azir has a 100% winrate (5 wins) with 7.3 KDA.
- Piglet is the ADC with the lowest death average (1.2 / game) of NA LCS.





Published: Aug 12, 2015 02:32 am