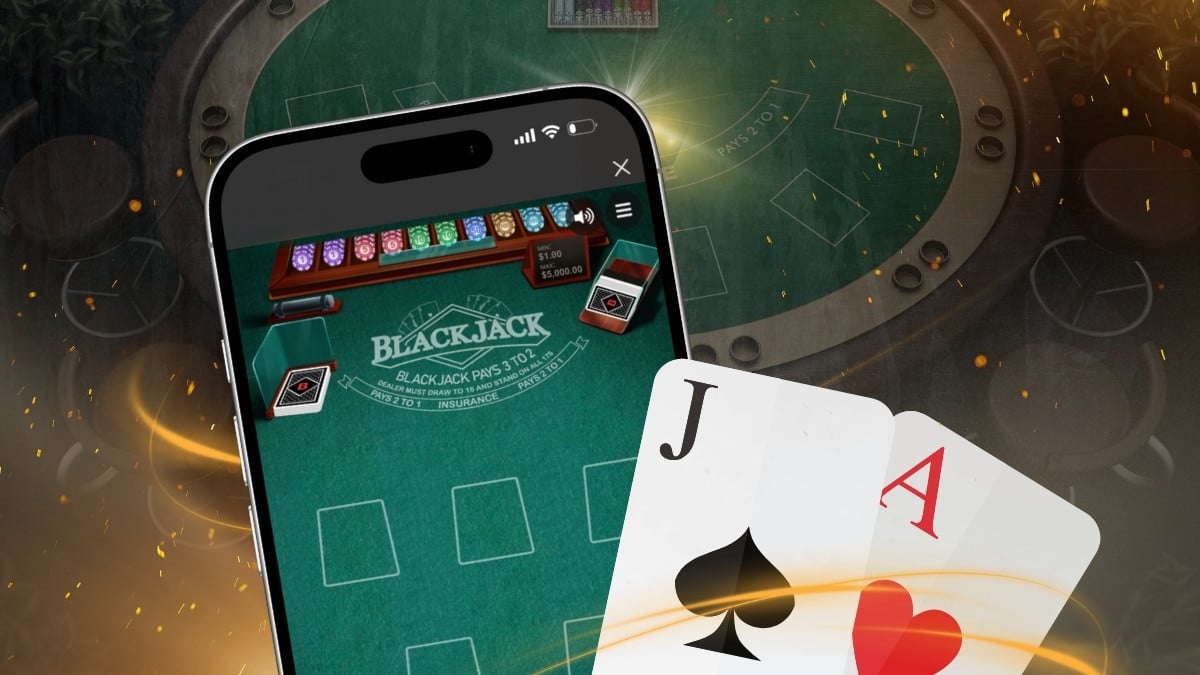
Blackjack stands apart from other casino games through its unique combination of chance and skill, where understanding probabilities directly impacts long-term outcomes. While luck determines individual hands, mathematical reality governs results across hundreds of sessions.
This examination explores the core probabilities driving blackjack decisions, analyzes how rule variations affect house edge, presents dealer bust frequencies by upcard, and explains when mathematics suggests hitting, standing, doubling, or splitting.
Core Blackjack Probabilities
Several fundamental probabilities shape every blackjack hand, determining optimal strategy regardless of specific rule variations.
Natural Blackjack Frequency
A natural blackjack (ace plus ten-value card) occurs approximately 4.83 percent of the time in single-deck games. This probability decreases slightly to 4.75 percent in six-deck shoes and 4.74 percent in eight-deck shoes.
The 3:2 payout on natural blackjacks represents one of the players’ primary advantages. Games offering 6:5 payouts on naturals dramatically worsen player odds, increasing the house edge by approximately 1.4 percent.
Dealer Final Hand Distribution
Dealers reach specific final totals at predictable frequencies. When following standard rules requiring hits to 16 and stands on all 17s:
| Dealer Final Total | Frequency |
| Bust | ~28% |
| 17 | ~15% |
| 18 | ~14% |
| 19 | ~13% |
| 20 | ~18% |
| 21 | ~7% |
Player Bust Probabilities
Player bust risk escalates rapidly with hand totals:
| Player Hand Total | Bust Probability When Hitting |
| Hard 12 | 31% |
| Hard 13 | 39% |
| Hard 14 | 46% |
| Hard 15 | 54% |
| Hard 16 | 62% |
This exponential increase explains why the basic strategy emphasizes conservative play with stiff totals against the dealer’s weak upcards.
Dealer Bust Odds by Upcard
The dealer’s upcard dramatically influences hand outcomes, with bust probabilities varying significantly based on the exposed card.
| Dealer Upcard | Bust Probability |
| 2 | 35.30% |
| 3 | 37.56% |
| 4 | 40.28% |
| 5 | 42.89% |
| 6 | 42.08% |
| 7 | 25.99% |
| 8 | 23.86% |
| 9 | 23.34% |
| 10 | 21.43% |
| Ace | 11.65% |
Weak Dealer Upcards (2-6)
Dealer upcards of 2 through 6 represent vulnerable positions with high bust frequencies ranging from 35 to 43 percent. These high bust rates explain the basic strategy’s emphasis on conservative play against weak dealer upcards. Players should avoid busting themselves when dealers face significant bust risk, as this allows dealer mistakes to generate wins without player risk. Understanding these fundamental probabilities helps players make informed decisions, and those seeking optimal playing conditions can explore the best blackjack sites offering favorable rule variations and competitive odds.
Neutral Dealer Upcards (7-9)
Dealer upcards of 7, 8, and 9 create more balanced situations with bust rates around 23-26 percent. These moderate bust rates require players to build strong hands rather than relying on dealer busts.
Strong Dealer Upcards (10, Ace)
Dealer upcards of 10 and ace represent powerful positions with low bust probabilities of 21 percent and 12 percent, respectively. These low bust rates explain why the basic strategy suggests aggressive player actions when facing these upcards.
Rule Variations and House Edge
Multiple rule variations significantly impact blackjack odds, with each modification adding or subtracting from the baseline house edge.
| Rule Variation | House Edge Impact |
| Dealer stands on soft 17 (S17) | Baseline |
| Dealer hits soft 17 (H17) | 0.0022 |
| Double after split allowed (DAS) | -0.14% |
| Single deck | ~0.17% edge |
| Six-deck shoe | ~0.46% edge |
| Eight-deck shoe | ~0.57% edge |
Stand on Soft 17 Versus Hit Soft 17
Games requiring dealers to stand on all 17s (S17) favor players compared to games where dealers hit soft 17 (H17). The H17 rule adds approximately 0.22 percent to the house edge by allowing dealers to improve weak hands that would otherwise stand.
Double After Split
Permitting double downs after splitting pairs (DAS) reduces the house edge by approximately 0.14 percent. This rule particularly benefits players holding small pairs against dealer weak upcards, enabling aggressive plays that maximize profit in favorable situations.
Deck Number Impact
Single-deck games offer the lowest house edge, approximately 0.17 percent under typical rules. Six-deck shoes increase the house edge to roughly 0.46 percent, while eight-deck shoes reach about 0.57 percent under identical regulations. Players comparing game offerings should examine rule sets carefully, as some new online casinos launch with particularly player-friendly variations to attract customers.
Strategic Decision Points
Mathematical analysis reveals optimal actions for every possible player hand versus dealer upcard combination.
Hard Hand Strategy
Hard hands lacking aces present straightforward decision trees:
- Hard 17+: Stand against all dealer upcards
- Hard 13-16: Stand against dealer 2-6, hit against dealer 7-ace
- Hard 12: Hit against dealer 2-3, stand against dealer 4-6, hit against dealer 7-ace
- Hard 11 or less: Always hit (or double when appropriate)
Soft Hand Strategy
Soft hands containing aces provide flexibility through the ace’s dual value. Players should never voluntarily bust soft hands, as this makes soft hand strategy more aggressive than hard hand play.
- Soft 19-20: Stand against all dealer upcards
- Soft 18: Stand against dealer 2, 7, and 8; double against 3-6; hit against 9, 10, and ace
- Soft 13-17: Hit against dealer 2 and 7-ace; double against dealer 3-6 when rules permit
Double Down Opportunities
Doubling down provides players’ primary offensive weapon, allowing doubled wagers on strong hands in favorable situations:
- Hard 11: Double against all dealer upcards except ace
- Hard 10: Double against dealer 2-9
- Hard 9: Double against dealer 3-6
- Soft hands: Follow the soft hand strategy above for doubling opportunities
Pair Splitting Strategy
Splitting pairs creates complex situations requiring careful analysis:
Always Split:
- Aces
- 8s
Never Split:
- 5s
- 10s
Conditional Splits:
- 2s, 3s, 6s, 7s: Split against dealer 2-7
- 4s: Split only against dealer 5-6
- 9s: Split against dealer 2-6 and 8-9; stand against dealer 7 (where 18 likely wins); don’t split against dealer 10 or ace
Players looking to refine their splitting decisions and overall strategy can review comprehensive blackjack tips covering additional strategic principles.
Expected Loss Under Basic Strategy
Understanding long-term mathematical expectations helps players set realistic goals and manage bankrolls appropriately.
House Edge Calculation
A standard six-deck game with S17, DAS, and resplit to four hands creates a house edge of approximately 0.40 percent under perfect basic strategy. This translates to a theoretical loss of $0.40 per $100 wagered over infinite hands.
In practical terms, a player wagering $25 per hand for 100 hands risks $2,500 total with an expected loss of $10 under basic strategy play. Short-term variance means actual results deviate significantly from expectations, but long-term results converge toward theoretical values.
Variance and Standard Deviation
Blackjack’s standard deviation approximates 1.15 betting units per hand, meaning two-thirds of sessions fall within 1.15 units above or below expected results per hand played. This substantial variance explains why players experience winning and losing streaks despite playing an optimal strategy.
Side Bets and Odds
Side bets dramatically alter blackjack’s risk-reward profile, typically featuring much higher house edges than the base game.
Insurance Bet Analysis
Insurance (available when the dealer’s upcard is an ace) provides a 2:1 payout when the dealer holds blackjack. Insurance carries approximately 7.47 percent house edge in six-deck games, making it poor value despite seeming like protection. Players lose insurance bets roughly 69 percent of the time, generating significant long-term losses.
Common Side Bet House Edges
Beyond insurance, numerous other side bets feature even higher house edges that substantially increase the casino’s mathematical advantage.
| Side Bet Type | Typical House Edge |
| Perfect Pairs | 2-6% |
| 21+3 | 2-10% |
| Royal Match | 3-10% |
| Lucky Ladies | 15-25% |
These side bets represent much worse odds than the base game. Comparing side bet structures across different online casinos reveals significant variation in paytables and available wager options.
Common Probability Misconceptions
Several persistent myths about blackjack probabilities lead players toward poor decisions, even though they seem logical.
The Gambler’s Fallacy
Many players believe cards are “due” after extended runs, assuming past results influence future independent trials. Each hand represents an independent event with unchanging probabilities determined by the remaining cards. Betting strategies based on “hot” or “cold” streaks ignore mathematical reality.
Dealer Showing Ten Myth
Some players assume dealer ten-value upcards frequently hide blackjack, leading to overly conservative play. In six-deck shoes, the dealer showing 10 has blackjack only 30.77 percent of the time (less than one-third of hands). While significant, this rate shouldn’t paralyze player strategy.
Reading and Applying Odds Charts
Effective chart usage requires understanding notation and implementing strategies without slowing gameplay.
Basic Strategy Chart Structure
Standard basic strategy charts display player hands along the left axis and dealer upcards across the top. Chart intersections indicate optimal actions:
- H: Hit
- S: Stand
- D: Double (hit if doubling unavailable)
- P: Split
- SU: Surrender (when available)
Memorization Techniques
Rather than memorizing individual cells, players should learn strategy principles and exceptions. Master dealer bust probabilities by upcard first, then understand why certain actions optimize results given those probabilities. Utilizing gambling apps designed for blackjack strategy training helps players develop comfort with decision-making before risking real money.
Bankroll Management and Odds
Understanding probabilities informs appropriate bet sizing and bankroll requirements for sustainable play. Players should maintain bankrolls of 50-100 times their typical bet for an adequate cushion against normal variance. Flat betting (consistent wager sizes) proves optimal for basic strategy players, as progressive betting systems don’t overcome the house edge.
Playing the Percentages
Blackjack’s mathematical foundation transforms the game from pure chance into skillful competition against the house edge. Understanding dealer bust probabilities by upcard, recognizing how rule variations affect odds, and executing basic strategy creates the optimal playing approach.
While short-term variance produces winning and losing sessions regardless of strategy quality, long-term results inevitably reflect mathematical reality. Players applying perfect basic strategy face house edges under one percent in favorable games (among the best odds in casino gambling).
Mastering blackjack odds separates informed players from gamblers relying on hunches. The cards don’t remember past hands, and streaks hold no predictive value. Each decision either aligns with mathematical optimality or concedes additional edge to the house. Understanding and applying these probability principles determines whether players achieve theoretical minimum loss rates or inflate house advantage through strategic errors.


Published: Oct 20, 2025 11:37 am