Statistics.
They can be both our greatest ally and worst enemy in trying to understand an issue. The use of quantitative reasoning is the best way to understand a subject, and enables us to use that knowledge to predict the future. But numbers are persuasive, and if presented wrongly (intentionally or un-) they can do great harm. “Lies, damned lies, and statistics” – Mark Twain.
So what does that mean for us, noble consumers of League of Legends content?
As Riot has introduced better match history data for professional matches, statistics coverage of the major leagues has blossomed. From articles (http://www.goldper10.com/stat/987) to databases (oracleselixir.com) statistics are now part of discussions. Recent news regarding TSM brought up the fact that Wildturtle does little damage compared to his adc peers; this was used as a point in favor of replacing him. But can we trust these statistics and use them as stand alone arguments?
If we look at other professional sports, the answer to the above is a resounding yes. The “moneyball” concepts and advanced analytics have become a part of MLB, NBA, and NFL discussions. In baseball, each player has a statistic that is literally the number of wins they are worth to the team – WAR, wins above replacement. We can pick two players and decide who is better solely based on this stat. Which is great, both for teams deciding who to pay, and players, deciding who to follow.
With League of Legends, the question becomes murky. The answer becomes “probably not.” Any individual statistic is affected by team playstyle. Small sample size makes outlying performances stick out. And no one stat can quantify every impact a great player will have. Lets run through a couple examples for fun.
Start with effects of playstyle. Pick a stat. Damage per minute is effected by how “bloody” a team plays; more teamfights will give more damage. In addition, damage dealt does not scale linearly with game length; late game fights will result in much greater damage. Kill participation percentage reflects the style of fighting; 1v1s and skirmishing versus 5v5 teamfights. And gold distribution will be skewed by a splitpusher.
Sample size is easy to understand. In baseball, a player may average 4 at-bats per game, over a 162 game season. An NBA team can have 100 possessions per game, with 82 games in a season. The NA and EU LCS have 18 games per split, two splits per year, for a total of … 36. Add in 30 playoff games (2 seasons x 3 bo5) and we still can’t approach the numbers of other sports. Part of this is the fact that a game of League cannot be broken into smaller parts. Counting possessions or at-bats gives a far larger sample size, lending to a stronger statistical argument.
For a numerical example, lets look at gold distribution.
One good way to understand how a team plays is looking at who gets what percent of the total team gold. This scales to a teams performance, so (theoretically) the stat can be compared amongst teams with different records.
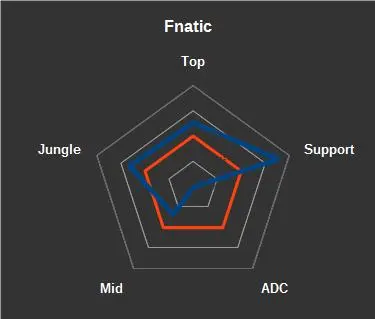
But this isn’t completely true. The nature of this comparison is that adding a set amount to each players total will skew the ratio. A winning team gains more teamwide gold from objectives. So lets look at how this matters, using Fnatic (14-0) and Copenhagen Wolves (2-12) as examples.
This stat is pretty simple – players total gold / team total gold, minus passive gold generation. Each players percentage can be compared to the average for the league, and graphed for visual reference. A long article on the subject can be found at thescoreesports (link below).
What we will do is first look at this stat normally, then add (or subtract) the value of turrets. Assume 3 outers are all that are destroyed in a loss; 3 outer, 3 inner, 2 inhib, and 2 nexus in a win. That gives us a difference of 1260 gold per game, added to each players total. When a player (especially supporty roles) may only earn 10k per game, that makes a big difference. How big? Lets look:


These aren’t true values, just estimates. And comparing to the average exaggerates the difference. But we see that towers destroyed makes a big difference in gold shares. And this is just one factor.
Looking at thescore’s article, we see Fnc, H2k, and OG all give above average gold to their supports. All three teams have strong support players … and good records. Some of their high gold share may just be due to the large amount of global gold earned by the team in their winning ways.
So what does this mean? We can’t discredit all statistics on the possibility of flaws. This data is still valuable, we just need to understand factors that are unexplained in numbers. Thus: League of Legends statistics are valueless without context.
Moving beyond all the doom and gloom, we need to continue supporting statistical based analysis. We just need to emphasize context in our understanding. Eventually we will develop advanced metrics that stand on their own; until then, be wary of statistics in your arguments.
TheScoreEsports article referenced: http://www.thescoreesports.com/lol/news/2563


Published: Jul 16, 2015 12:26 am