With the full NA LCS 2015 Spring split wrapped up, post-mortem season is in full swing. One way to review player performances over the past few months is to compare statistics, and today we’re going to mull over the AD Carry position and see what trends we can identify.
I’ve chosen to highlight a few specific stats with charts, but there are many more statistics available on the Oracle’s Elixir version of this article.
All statistics in this article are based on all NA LCS 2015 Spring split games, including the nine weeks of the regular season, tiebreaker games, and playoff games.
Note to Readers
Statistics are only one tool available for measuring player performance. This article is not meant to be a comprehensive player assessment to rank North American AD Carry players. It may show us some interesting things, but the findings from these numbers should always be put in context with other factors such as individual and team play style, champions used, game lengths, and so on.
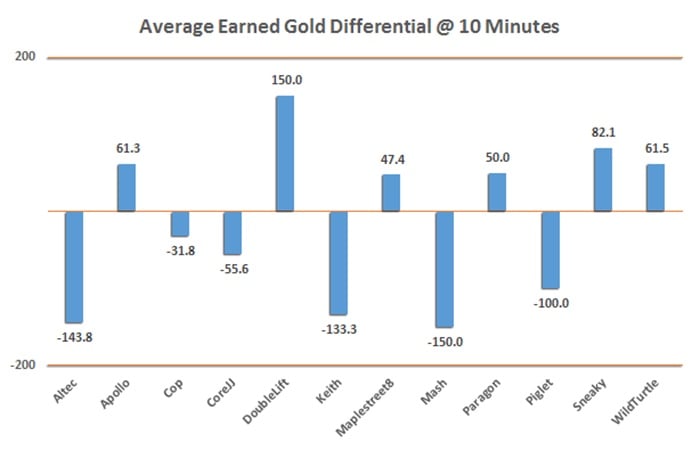
Lane Phase: Gold Differential at 10 Minutes
- The “Earned Gold Differential at 10 Minutes” statistic measures the AD Carry player’s and opposing AD Carry’s earned gold at the 10-minute mark, takes the difference, and then averages that difference across all games played. These numbers are based on gold values rounded to the nearest hundred, which is the level of detail available in Riot’s match histories. Rounding errors may have some small influence on the values.
 The big early-game winner in gold differential was DoubleLift. CLG as a whole had the most dominant early game of any NA LCS team, so this isn’t surprising. Apollo, Sneaky, and WildTurtle also did a great job of gaining gold advantages during the first 10 minutes.
Mash, Altec, and both of Team Liquid’s ADCs had rough early games, usually allowing their opponents to accumulate leads.
Food for Thought:
Since gold amounts come not only from farm, but also from kills/assists and also from early towers, these numbers are in some cases a symptom of gank priorities, and can also reflect lane swap scenarios where one team rapidly shoves down an enemy turret. These stats can’t capture those nuances, but some of that information can be found in other places, including the full stats table at the bottom of this article and the Oracle’s Elixir Team Statistics tables for the regular season and the playoffs.
For example, when we see that DoubleLift had eight First Blood kills/assists and zero First Blood deaths across the whole season, it shows that a lot of his gold advantages came from early kills, whether that came from gank pressure or just DoubleLift and Aphromoo playing aggressively.
WildTurtle benefited more from early tower kills, with TSM taking the first tower of the game 78% of the time this season. (Many of those towers went down after the 10-minute mark, which is why Turtle’s number isn’t higher.)
Piglet, meanwhile, gave up three First Blood deaths this split, with only three First Blood kills/assists of his own, which implies that part of his disadvantages came from his opponents’ kill/assist gold.
Damage to Champions per Minute
- Damage to champions per minute is calculated separately for each game, then averaged across all games played. Bear in mind that this stat can be inflated by playing longer games, or by playing high-poke champions like Corki or Kog’Maw.
 In Keith’s six games with Team Liquid, he absolutely pumped out the damage, thanks in part to having two 50-minute games among those six, as well as playing Corki twice and Kog’Maw once.
WildTurtle’s high number also benefits from sharing a 54-minute game with Keith, but on average his games were shorter than Keith’s, bringing his stats a little more down to earth.
Maplestreet’s damage output was third lowest, and if we glance down at the damage share numbers in the next section we see that his share of his team’s total damage was the lowest of any AD Carry, as well. His preference for playing Graves and Sivir, who tend towards lower sustained damage output, is partly at the root of this. It seems that Team8 simply relied on other sources to provide more of their damage.
Contribution to the Team: Damage Share and Gold Share
- Damage share is the percentage of the team’s total damage to champions that was contributed by the player, calculated separately for each game and then averaged across all games played.
- Gold share is the percentage of the team’s total gold held by the player, calculated separately for each game and then averaged across all games played. Gold share is based on “earned” gold, which excludes each player’s 475 starting gold and the inherent gold gain of 1.9 per second that starts at 90 seconds.

 (You can click the table to get a full-size view if the numbers aren’t readable.)
Gold share and damage share aren’t directly related, but they do influence one another. Three players stand out to me as especially interesting based on this chart.
Sneaky
Most people seem to agree that Sneaky was the cream of the crop among NA LCS AD Carries this split, and this chart should support that opinion. Sneaky wasn’t heavily prioritized for gold share, but he was even more heavily relied upon for his damage output than Keith, whose damage numbers were off the charts (as discussed above). This contrasts with players like Altec, Cop, and CoreJJ, who also had high damage shares but were using a larger share of their teams’ gold to get there.
DoubleLift
There has been a lot of conversation about DoubleLift since CLG bowed out of the playoffs early this split. These numbers don’t really help his case: DoubleLift’s damage share was below average, and that can’t be blamed on ZionSpartan’s damage contributions out of Top lane. (Zion had the 9th-highest damage share among NA Top laners this split.) It was actually Link who took on the lion’s share of CLG’s damage output, with the second-highest damage share among all Mid laners (behind Bjergsen). But DoubleLift raked in an above-average share of his team’s gold, tied with Cop for the second-highest gold share among NA ADCs. Why wasn’t DoubleLift able to match Cop’s ability to convert gold into damage? That’s a deeper question than these stats can answer.
Maplestreet
As discussed in the previous section, Maplestreet did the lowest share of team damage of any AD Carry. When we put that alongside his gold share, though, we get another clue about why that was the case: only Apollo took home less of his team’s gold than Maplestreet. It’s difficult to create damage output when your wallet is relatively empty. In Team8’s case, that gold was being funneled pretty heavily into Calitrlolz, who was also contributing a larger share than usual of the team’s damage for a Top laner. These stats show that Maplestreet wasn’t as high of a carry priority as most other ADCs.
Full Stats Table
For a sortable, scrollable table of ADC stats from the past split, head to the Oracle’s Elixir post and scroll to the bottom of the page.

Click the table for a full-size, readable view, or go to Oracle’s Elixir for a sortable, scrollable version.
A few other small highlights from these statistics:
- Altec and Sneaky both had 78% average kill participation, showing how reliant their teams were on their ADCs to be present at every fight. Maplestreet and Mash, meanwhile, only participated in 64% and 65% of their teams’ kills, respectively, implying that more of those teams’ action happened in other lanes.
- Among ADCs who played at least 10 games, it’s impressive that Cop, DoubleLift, and Sneaky were never killed for First Blood this split. In Sneaky’s case, that spans 28 games.
- Maplestreet and DoubleLift were the biggest vision contributors among ADCs, both placing fairly high numbers of wards, but Mash and CoreJJ provided more ward clearing value.
If you found these stats interesting or useful, leave a comment and let me know! If the interest is there, I can put together similar charts and tables for other positions.
You can find more NA LCS statistics for both players and teams in the Statistics section of Oracle’s Elixir.


Published: Apr 23, 2015 08:31 am