Preface
They say money makes the world go ’round. It’s as true in League of Legends as it is in life. Gold is the most straightforward statistic for measuring a team’s power level in a game of League of Legends.
The total gold earned by both teams is often compared throughout a game to measure who is in the lead, but gold spent is the real number that tells us who is stronger at any point in time. The amount of gold spent by each team at the end of a game is a great way to see how dominant the winning team’s victory was: it gives us a more accurate picture than gold earned, because the winning team’s totals aren’t inflated by gold earned during the last game-winning team fight, or from killing enemies on the fountain just for fun.
Note: One alternate interpretation for some of these numbers is that some teams may have “needed” larger gold leads to allow them to win. That’s a complicated observation, but it’s something to keep in mind in the following discussion.
The Data: NA LCS 2015 Spring Split
Let’s take a look at the teams in the North American League Championship Series and see which teams were able to take crushing wins, which teams barely squeaked out their victories, and which teams kept games close even in their losses.

Data includes all games from the regular season, tiebreakers, and playoffs. Promotion/Relegation games are not included.
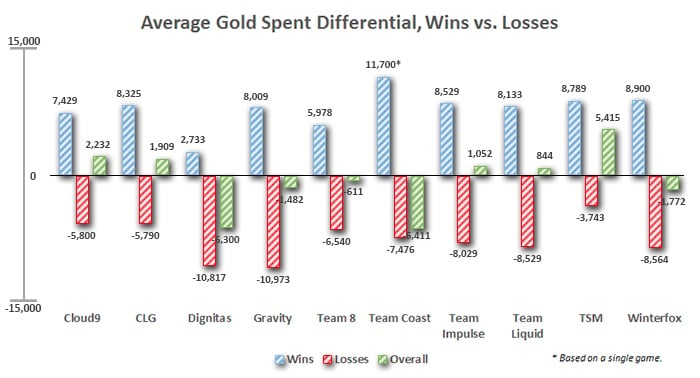
Overall, TSM had the highest average gold spent differential, almost 2.5 times the second-best team. Cloud9, CLG, Team Impulse, and Team Liquid all ended the split with positive differentials.
In wins, Team Coast managed to snowball their single victory incredibly hard (or perhaps you could say that they needed a much bigger gold lead than other teams to secure their victory!). Among teams with multiple wins, Winterfox snowballed their wins the hardest, followed by TSM and Team Impulse.
Gravity suffered the worst blowouts, with the lowest gold spent differential in losses, closely followed by Dignitas. Winterfox, Team Liquid, and Team Impulse also fell hard in their losses.
Notes on Specific Teams
Cloud9
The second-place finishers played very close games throughout the split. Overall, C9’s gold spent differential was second-highest in the league, but this was because of how close they kept things in their losses. Cloud9 had only the eighth-best differential in their wins, but had the third-best differential in their losses.
They were able to do this by giving up only 8.5 tower kills to their opponents during losses, the best number in the league by far, while securing 4.1 towers of their own in those losses, third behind CLG and Team 8.
Team 8
Calitrlolz and his fellow newcomers to the LCS had the lowest gold spent differential in wins of any team. This suggests that they weren’t able to methodically extend out their leads to take wins: if a team is moving around the map taking objectives, then returning to base to convert their gold into items, they should have higher gold spent differentials.
Instead, Team 8 seemed to rely on winning close victories through game-ending team fights, which set them up to instantly turn from a fight and rush down the enemy Nexus. That style of victory doesn’t allow a team to return to base and shop; they end up with a larger amount of gold still in their wallets at game’s end.
More confirmation comes from Team 8’s tower kills numbers: on average in their wins, T8 allowed their opponents to kill 4.3 towers per game, second-worst behind Dignitas, and they only killed 9.4 towers per game in wins, third-worst ahead of only Dignitas and Team Liquid.
Team Solo Mid
North America’s best team comes through strong in gold spent differential, with the highest overall differential at 5,415. They also had the best differential in losses, never rolling over easily. SM’s giant leads came from dominant map play, with an overall average of 8.1 tower kills per game and only 5.1 opponent tower kills per game (both best in the league).
Winterfox
The now-relegated Korean-heavy squad embodied the term “snowball”, based on this statistic. When they won, Winterfox won big, with the highest gold spent differential in wins (outside of Coast’s single victory), but when they lost, they lost big, too. Unfortunately for them, they lost more than they won. Too many times, the snowball got rolling against them.
WFX’s tower kill numbers illustrate the point: in wins, they killed 9.6 towers and gave up a mere 3.3 of their own towers. Excluding Coast’s single victory, only CLG and Team Liquid gave up fewer tower kills in their wins.
But in WFX’s losses, they only took 3.2 tower kills of their own, and gave up 10.1 tower kills to their opponents. Only Dignitas gave up more tower kills in losses.
Summary
Wins and losses are the most important team statistic, but how you win can be almost as important. From TSM’s sheer dominance to Coast’s empty wallets, Team 8’s narrow, white-knuckle victories to Winterfox’s giant snowballs, both for and against, different teams took different paths to victory—and defeat—in the 2015 NA LCS Spring Split.
How did your favourite team perform? Did this match up with your perspectives on each team, or were there any surprises?
If you found this interesting, tou can find more NA LCS statistics for both players and teams in the Statistics section of Oracle’s Elixir.
Statistics and Interpretation: Tim “Mag1c” Sevenhuysen
Graphics: “Daniel “Exorant” Hume“


Published: May 1, 2015 02:21 pm