This is a second part of the original article which includes all the raw data and summary of game lengths played in NA on each individual patch since the establishment of LCS. Please refer to that article, since it explains the reason as for why and how analyzing and interpreting these stats and graphs pertains to “meta” and game balance.
This article will be composed of two parts: the first part, just like the first article, I give basic summarized stats and graphs for EU LCS game lengths, and in the second part, I compare them to NA data that was presented in first article.
Data Collection and Assumptions
- The majority of game length times for each respective split were collected manually through the data available through eSportspedia (Leaguepedia) website. When the results of the matches were missing from the website, the timing was collected straight from the VOD’s of those matches.
- The game counts as officially ended when the Nexus’ hp drops to ‘0’ (NOT when the timer stops)
- To identify the patch that each respective games were played on, I followed the official rule regarding “Competitive Patch & Tournament Realm” in each LCS splits rulebook.
- Raw data was collected and analyzed in a spreadsheet software
Results and Graphs (EU)
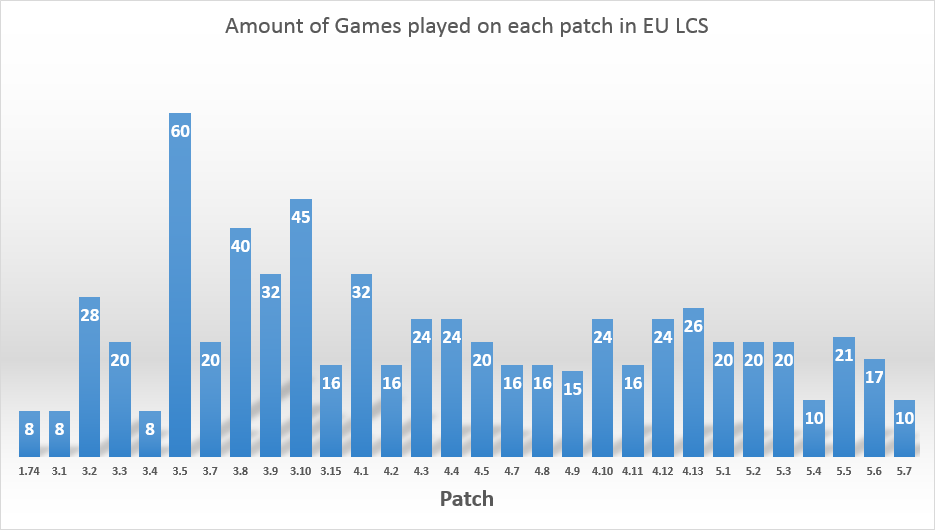
Since the establishment of EU league, 656 games have been played on 30 different patches with a total average of 39.02 minutes per game. The following column chart shows the amount of games played on each one of those patches starting with 1.74 (Season 3).
 For full resolution, click here.
The purpose of this graph is to give you an idea of what was the distribution of raw data like among the patches and to give a representation of the sample size.
The following is a table containing summarized and partially analyzed data of all the game length times through out all the splits of EU LCS, followed by a line chart for visual representation.
 For full resolution, click here.
 For full resolution, click here.
EU vs NA
In this section, you can find the general comparison of EU LCS comparing to NA LCS. The following are a column graph comparing games played per patch between 2 regions, and a line graph comparing the average trend of game lengths.
 For full resolution, click here.
 For full resolution, click here.
Observations
After 5 splits, NA has hosted 659 games, while EU has hosted 656. The amount of games played per each patch is almost exactly the same, for the exception of playoff patches, where games obviously vary based on how far the series progress, and some random patches in Season 3, when LCS wasn’t as established and organized as it is today.
Let’s talk Patch 3.8 and Patch 3.9. The sample size for these patches is enough for both leagues to actually analyze the difference between average game lengths. Patch 3.8 brought some massive changes to very popular items, including a bump on experience stats of red and blue, increased monster spawn at 1:55 (instead of 1:40, which allows laners to kill a camp and come to lane with more experience, which potentially could snowball games), and other tweaks. With these changes in the jungle, European teams with good coordination and predominantly map-control oriented junglers started prioritizing Nunu in champion select. The main strategy was to counter jungle and deny as much experience to enemy junglers, who most of the time were Spirit of the Ancient Lizard junglers (J4 was a power pick in ~3.7). Because of those balance changes, it took more times for enemy junglers to gain experience, more time to gank lanes and more time to close out the games. NA started seeing Nunu’s during the 5th week of summer split of 2013, but the scene was still dominated by aggressive playstyle and junglers like J4, Lee Sin, Eve and Xin Xhao. That playstyle helped NA close out games faster.
Another interesting point when comparing trends, the middle of summer split of S4 seemed to be another point for EU when closing out games became a problem. Right after a return from All Stars, Europe didn’t let go of Shyvana power pick mentality, and she made her way almost in every pick/ban phase. During those first few weeks of summer split, on top of waiting for Shyvana to reach her power spikes and scale into late game, European junglers would invest a lot of gold into controlling vision and playing early games junglers who would become tanks in late game (notorious Lee Sin was highly prioritized in almost every game). At the same time, while Dignitas was one of the first teams to use their jungler to set up deep vision and control flow of early and mid game, the aggressive playstyle primarily dictated by bottom lane and scrimmage junglers still had heavy impact on the length time. Middle lane picks were mostly team fight oriented (or pre-rework Nidalee) which would explain team’s desire to group early and fight during first power spikes, and would eventually lead to shorter games.
Statistical Analysis
A general question that I’m trying to answer in this section – Is the difference in average time between regions significant?
For this, I conducted a basic paired t-test, and the goal was to find variations between regions during each split (not each patch). Using the significance level of 0.05, that would yield me results within a 95% confidence interval. Since all sample sizes are well above 30, we don’t have to worry about the normal distribution requirement of the test.
H0: u = 0,
H1: u ? 0

For full resolution, click here.
Only for spring of 2014 we reject the null hypothesis, since p is less than significance level.
Summary
- The total average shows that in the past 2.5 years, EU games have been longer by 2.08 minutes based on the summary of raw data of every single game (1315 games total)
- Despite fluctuations from the mid values and average for each region, only during a split out of 5 the difference between regions was statistically significant.
- Both regions adapt to meta and balance changes differently, but at the end of the day common strategies are traced across both.
- Adaption to big patches seems to be the major reason why games in NA tend to be longer while EU is mostly preoccupied with strategic decisions and picks that tend to prolong games to late phases.






Published: May 17, 2015 04:21 am