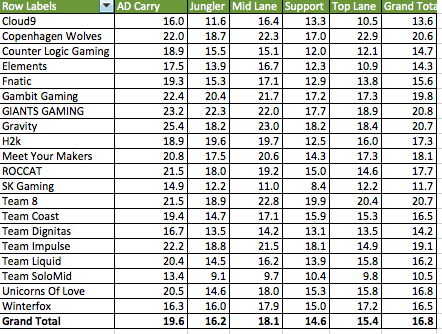
I was finally able to get my hands on the data I need to calculate ‘defense against position’ for LCS teams. For some other daily fantasy sports this is a really useful approach to making picks. For example in NBA contests, it’s best to steer clear of point guards playing against Chris Paul. And in NFL contests, the Jets are generally tough against the runnings backs, but pretty easier for quarterbacks to exploit. What follows is data on how each LCS team fares against their opponents at each position.
Note: The scoring system used for this article is based on AlphaDraft‘s scoring system, but Vulcun (invite code: PROFANTASY3) is similar enough that using this data as guidance should work fine.

The chart above shows average points per game allowed to each position by each team for the first four weeks of the season. It also shows average points allowed to all positions combined by each team and average points allowed to each position by all teams combined. As you’d expect, the best teams are generally hard to score against (with TSM and SK leading the way), while weaker teams tend to be easier to score against. One thing to keep in mind is that if you’re using the betting odds on a game as a guide and you’re also looking at this raw data, you’re essentially ‘double counting’ the strength of a team’s ability to suppress their opponents’ points.

The second chart essentially normalizes the data by position. So instead of showing the average points per game allowed to each position, it compares that to the average for each position. ADCs tend to score the most, so a team that allows an average amount of points to ADCs (19.6 points) will show a 1.00 here, while a team that allows an average amount of points (16.2) to Junglers will also show a 1.00. Higher than 1 means that the team allows an above average number of points to that position. Lower than 1 means that the team allows a below average number of points to the position.

The third chart tries to address the ‘double counting’ problem that I mentioned earlier. Instead of comparing each team’s defensive results to other teams’ results against the same position, it compares them to the same team’s results against other positions. So it’s taking the data from the third chart and normalizing it based on the the average for that team. For example, while Team Impulse is weak defensively against all positions, except for Top Lane (where they’re barely above average), when you compare their top lane results to their average, it’s outstanding (at .85). So while you wouldn’t normally be afraid to pick an opponent of Team Impulse, if they’re playing a weak opponent, you should definitely steer clear of the top laner on the opposing team!
I’m planning to update the data in all three of these charts on a weekly basis at: ProFantasyESports.
Note: The scoring system used for this article is based on AlphaDraft‘s scoring system, but Vulcun (invite code: PROFANTASY3) is similar enough that using this data as guidance should work fine.


Published: Feb 21, 2015 05:34 am