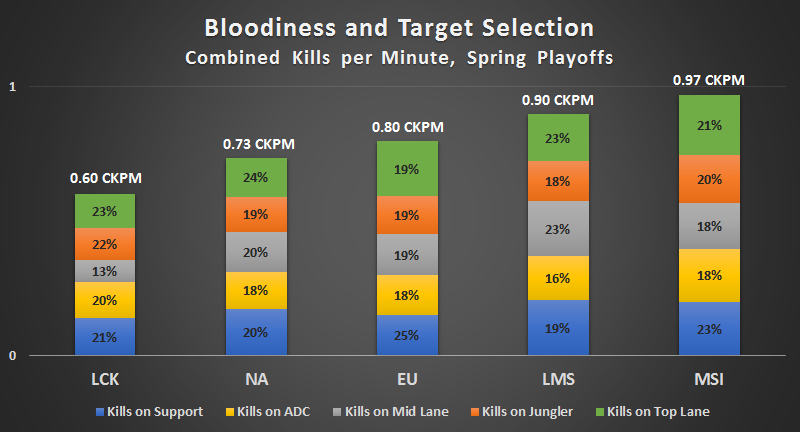
The 2015 Mid-Season Invitational was an absolute bloodbath, with 62% more kills per minute than the LCK playoffs and a way faster pace than anyone could have expected, based on how each region’s playoffs played out.
The chart below compares the average Combined Kills per Minute (CKPM) from each major region’s playoffs and the entire Mid-Season Invitational tournament. (The LPL unfortunately can’t be included because the league does not release its match histories publicly.) As an added bonus, I’ve broken out average target selection for each region.

Highlights
Look at the massive difference in pace between the LCK playoffs and the MSI tournament. On average, there were 62% more kills per minute at MSI than in the Korean playoffs. Korean teams play a relatively slow, controlled game, and it shows in these numbers. The crazy kill pace at MSI, which was so far outside of SKT’s comfort zone, was part of the reason EDG was able to beat SKT, and why Fnatic almost beat them, too.
LCK Mid laners took the least target focus of any position in any league, only averaging 13% of team deaths. SKT’s Easyhoon and Faker each died 5 times in 4 games, and Jin Air’s GBM died only 3 times in 3 games. Impressive stuff.
The LMS playoffs were a gauntlet format like the LCK, and AHQ ran that gauntlet, playing in all 10 of the league’s playoff games and winning nine of them. They pulled off their victories by raining down the killing blows, a tactic that they unfortunately weren’t able to capitalize on at MSI.
North America‘s relatively slow kill pace is due in part to Cloud9’s run to the Finals. They’ve had the lowest CKPM in the NA LCS for a long time, thanks to their meticulous map movements and priority on objectives and sieging. But even outside of Cloud9, North American teams in general played a more controlled game than their European and Taiwanese counterparts. NA had the highest kill focus on Top laners, which suggests that they did relatively more kiting and disengaging, staying back while hitting the tanks. Or maybe it was just because everybody camped Dyrus!
Looking at Europe‘s numbers, I expected their aggression to largely be thanks to Fnatic. But FNC actually had only the fourth-highest CKPM in the EU playoffs, at 0.79, topped by the Unicorns of Love, Copenhagen Wolves, and Gambit Gaming, with 0.85, 0.84, and 0.83 respectively. EU’s Support players gave up 25% of deaths, on average, led by CW Unlimited’s 4.0 deaths per game and UoL Hylissang’s 3.9.
Where does the LPL fall into this hierarchy? Based on reputation, they would be somewhere on the high side, perhaps on the same level as the EU LCS. It would be possible to get an average CKPM for the LPL by hand collecting the data, so if someone is willing to put that time in, please go ahead and share the results with everyone!
Conclusion and Notes
It’s obvious that different teams and different regions play the game differently. CKPM and average target selection give us two points of comparison.
The Summer Split is just getting underway, so if you want to watch the bloodiest games possible, why not check out some LMS matches? Or if you prefer chess matches, check out the LCK instead, especially if SK Telecom T1 is playing!
Notes
For context, the numbers above are based on the following numbers of games:
- LCK: 11 games, SKT victors
- NA: 25 games, TSM victors
- EU: 27 games, FNC victors
- LMS: 10 games, AHQ victors
- MSI: 28 games, EDG victors
For stats buffs, I ran t-tests for CKPM between leagues and found significant differences (p < 0.05) in every paired comparison except for NA and EU playoffs. (For the record, I don't think statistical significance is really necessary to make it worthwhile to discuss sports statistics, but it's affirming to see low p values anyways!)
Looking for LoL statistics for players and teams from the major leagues? Check out OraclesElixir.com, updated regularly.
Statistics and Interpretation: Tim “Mag1c” Sevenhuysen


Published: May 21, 2015 12:21 am