Statistics – Their Use and Analysis
“Statistics – The Mathematical Theory of Ignorance”
Morris Kline
Morris Kline was a Mathematics Professor at the University of New York who has written extensively on the sociology of the teaching of mathematics and its original Greek roots. Throughout his career he was critical of the process that mathematics was taught and blamed the teachers of mathematics and their failure to not include physics as a part of the learning curriculum (Physics and Mathematics are taught as separate topics, but cross theoretical paths innumerable times). This complex and somewhat esoteric concept carried considerable weight in the 50’s, and he seemed to be championing some significant change in syllabus and curriculum in secondary and tertiary institutions in the US (until he became a critic of these changes too). Kline was what could be referred to as a Pure Scientist – Maths and Physics as science were what he was best at, and this was probably due to the fact that his mind was particularly conducive to learning in these topic areas and he excelled at them. For a layman, no amount of study and learning could hope to produce the thought processes of this man, and others like him. One of his more relevant criticisms (in relation to this topic) was that there was a developing culture of “Publish or Perish” inside academic circles. The notion of this follows the idea that if you aren’t producing research, theories, concepts, critiques and solutions to contemporary mathematical works, you were becoming less useful to the institution you were researching and working for because you were becoming less known in these academic circles. The institution therefore lost prestige by not producing work that “got people talking” and the name of said institution would become forgotten. In Kline’s view, this research was being forced rather than being created by a deep connection with the particular context of the problem and this in turn produced useless mathematics that had no other use than to continue to propagate more research and provided no real answers.
This leads to the quote I have included above and was one that Kline referenced to Statisticians and their incessant production of analysis. It basically means that he thought that Statisticians produced analysis simply for producing analysis and ignoring wider contextual relevance to the data they were using.
When we consider the eSports culture and Industry, there is an abundance of statistical analysis by various individuals across a plethora of eSports who have varying backgrounds. While analysis of statistics is important, the trend of “Analysis of Statisitcs” doesn’t add value to the knowledge and advancement of tactics, concepts and combination of player skills and characteristics in analysing a particular game as a whole.
How do you quantify happiness? Or sadness? Contentment?
For those less experienced with the topic, these above questions begin to unpack the concepts that I am trying to convey. How can “Analysis of Statistics” tell me how to be happy? How can statistical analysis tell me how happy I am? How sad I am? Contentment with life…how can we judge this based of the analysis of statistics?
These are big heavy questions, but bear with me. The concepts behind these questions are ones that we are going to process. These questions clearly don’t relate to League.
But one does, and it’s a question on the abilities of a particular player at a given time. We’ll get to that.
Statistics as a Snapshot
Statistics are simply a numerical snapshot of a particular event at a given time. Some statistics are simpler, some are more complex. Let’s relate this back to League of Legends now – enough with the questions of epistemology and big words.
Ive picked a few concepts I want to look at.
- SBENU Sonicboom – 0-11 as of 9/3/15.
- Rankings
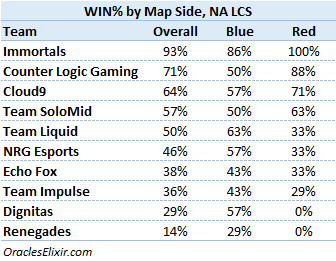
- Map Side Wins – NA LCS – (2/3/16, oracleselixir.com, Tim Sevenhuysen @Mag1cLoL, http://oracleselixir.com/2016/03/win-rates-by-map-side/)

Win Loss Records
Lets start with the SBENU record, which currently stands at 0 -11. A win loss record is a statistic. But it’s an extremely simple one. What can this statistic tell me about SBENU’s season so far? Nothing. Absolutely nothing. All it says is that they have lost 11 series. How? This statistic cannot tell us how. It’s not lying, it simply does not tell us the information we want to know. Exploring further, we can see they are 4-22 win loss for games. But what does this say? Not much more.
Looking further, Wins have come against CJ Entus, eM-fire, Longzhu and CJ again. Telling? No. Not at all. It just means you can read a website like lolesportpedia.com and navigate it to find the answers you require. If we were analysing the season SBENU have had up until now, we wouldn’t be getting very far at all.
This brings me to my first point. When it comes to high level statistical analysis, simple statistics don’t tell us enough about anything for someone to be able to make a proper adjudication on the performance of a particular team. While win loss is probably the simplest statistic around, other statistics can be counted that are also simple.
Note: I’m not making the point that analysis is done on win loss records – I haven’t read anything that is of the sort.
Rankings
The next statistics are significantly more complex than a win loss ratio, but are still simple in nature.
DoubleLift does the largest amount of DPM in NA. Simple mathematics can add this up for us. DPM however, doesn’t tell us a number of things. It doesn’t say When, Where, How, to Who and Why.
What else might help work this out?
He does 32.2% of the teams damage and takes 25.5% of the teams gold to be able to do this (not the most in NA). DoubleLift is consistently at or near the top of the ADC performance rankings when it comes to all of the “big numbers” – damage per minute, damage % of team, gold % of team and average gold per minute. It is safe to assume that these are excellent numbers for an ADC to have. DL has achieved this level of achievement across a number of seasons, and I don’t think anyone is going to say he is bad in his position.
You could rank DoubleLift and all of the NALCS ADC’s into a ranking system. You could also include lots of other statistics about the ADC position and use them to help to influence these rankings. More complex statistics are needed here to be able to do this, and there are two excellent websites to find these statistics – lol.esportspedia.com and oracleselixir.com. The people who curate these incredible websites do a fantastic job of updating them, adding new features to them and keeping them relevant for the community to utilise. You could find or keep statistics on team fight damage, 2v2 Damage, damage based on itemization; the list goes on. You could probably also work out statistics on when ADC’s get gold, and what they do with it and relate it back to their damage output.
Honestly though – who cares…
What is the point of ranking ADC’s simply based on their personal, individual performance? What’s the point of ranking players in individual positions in any team based sport? Their performance isn’t entirely influenced by themselves, the “individual”, in a game of League of Legends (if you just tilted, read that sentence again – keyword: entirely). They didn’t earn themselves all of those statistics through singular, individual performance. So why are we bothering to rank single positions? There is absolutely no quantifying information about how that particular position was able to gain those statistics based on the characteristics and performance of the rest of the team. Let’s consider Damage %age – DL can create excellent numbers.
When is he doing it?
Where is he doing it?
How has he output that damage? (Kiting, outside the fight, inside the fight, engaging, cleaning up etc)
Why is he and/or his team in that position?
Did they win this game?
Overall –
How often does this happen?
Who does this happen, and not happen against?
This is all information that requires, deeper, much more specific analysis. Moreover, it is going to require in game analysis of watching, observing, judging and questioning combined with statistical analysis. It is going to require something called Context.
Context – the circumstances that form the setting for an event, statement or idea, and in terms of which it can be fully understood.
Ranking ADC’s, no matter how deep your statistical analysis, is not going to provide Context as to how these ADC’s are able to achieve these numbers. It is also never, ever, going to explain why these ADC have these particular numbers. That job is incredibly big, long, deep and way too complex to achieve in a short period of time.
Most of the time, statistics are over a whole season. They are averages. Averages find Central Tendencies – that is, what does X statistic it look like more than half of the time, mostly ignoring any information that may want to buck the trend. Averages aren’t very good at accounting for things like outliers and variables. But there is a consistent and persistent attitude towards statistical analysis that relies on looking at, synthesising and analysing what these overall trends are (the averages), rather than looking at each game (event) as an entity unto itself.
Statistical analysis explains to us the What (what are the statistics) and the How (how did they get them). Fantasy Sports and Fantasy eSports (constant ramblings about skrilla and Alpha Draft are floating through my head right now thanks Thorin) are based around them. They are exciting to be a part of, and I certainly don’t think there is no value in ignoring these statistics. Having an understanding of what players are currently achieving numbers wise can be fun, involve lots of people and can spawn plenty of discussion. It can help to show trends that might give information about Meta, changes in the Meta, a shift in focus for a team over a particular period of time or help to define a change in tactic. Lots of What and How.
Why – That’s what I want to know
Above knowing the What (Lower Order Thinking) and How (Middle Order Thinking) is Why (High Order Thinking). By profession, I am a teacher, qualified in Australia to teach anyone up to the age of 20 or so, and have completed a number of courses to cater for the educational needs of Adults. There is lots of literature that supports a notion that the better you understand something, the greater your ability to synthesise it (or to things with it and to it). This is known as Bloom’s Taxonomy (Bloom, B. S.; Engelhart, M. D.; Furst, E. J.; Hill, W. H.; Krathwohl, D. R. (1956). Taxonomy of educational objectives: The classification of educational goals. Handbook I: Cognitive domain. New York: David McKay Company). To simplify –
Lower Order Thinking (highest % of people do this)
Remember (recall facts and concepts)
Understand (explain ideas and concepts
Middle Order Thinking (lower % of people do this)
Apply (use information in new situations)
Analyse (draw connections amongst ideas)
High Order Thinking (even lower % of people do this)
Evaluate (Justify a stand or position)
Create (Produce new or original work)
As you step through the levels, you take with you the abilities to add to and support your processes to create better understanding.
When it comes to statistical analysis in League, it’s not a bad thing to be using middle order thinking. Being able to analyse something is a process that few people can properly master. It is also a skill that can be created, honed and developed for those who may struggle with the concepts of proper analysis. But to be able to properly evaluate a player for a ranking system (for this example), it is disingenuous to simply stop at averaged statistics and call it an evaluation. Those statistics at their core, are averaged statistics that have been supported and influenced by the 4 other players on a team, and more importantly 5 other players on the opposition team. You are then simply evaluating the performance of said player in X role in any given season to a chosen point.
To properly evaluate (in terms of the Taxonomy above1) you need to observe in game performances of the player within the context of the team and the opposition to then be able to give context to a particular statistic that supports you making an observation. How does a team composition support a particular player’s damage statistics? How well does that team play that particular composition to be able to facilitate that particular players statistical attributes? Much of the statistical analysis I have read (not all of it, but a lot of it) focuses on the actual statistics rather than the reason for the creation of these particular statistics. Oracleselixir.com has created an absolutely wonderful and complex statistic for early game and mid onwards called EGR (early game rating) and MLR (mid/late rating). You can find the process that was used to create it here (http://oracleselixir.com/2015/10/egr-and-mlr-new-team-ratings/). Definitely recommend a read. The basic premise behind it is that it averages the performances of teams before 15mins, and then after 15mins. It’s a really good way at seeing an overall performance of a team over the period of a season, and can be very telling when it comes to trying to find correlations in data and performances (correlations = strong relationships between 2 or more things). It’s an awesome statistic, and useful to see overall trends in abilities of teams at periods of games.
However. There is a limitation to it, and it is one that its creator acknowledges so please read the above link. While it gives trends, it doesn’t give reasons as to why teams are successful early mid or late game, or why they are not. Its great to see that X team has a really strong late game, but a weak early game. But why is this the case? Are there teams that X team are strong against early? How does this correlate to winning and loosing? It’s almost a chance statistic, saying teams take this particular objective this many times at this particular time and loose it this many times. Great that you can point it out, but can you look deeper and tell me what led to them taking or losing the objective? If the EGR MLR is your first port of call, make sure you are looking at actual games, and more statistics to work out why these statistical ratings are the way they are. Just remember this – teams never willingly put themselves in a losing position (leave the NA memes out of this) when they lose a dragon/baron/objective fight. To say they only take this objective X% of the time begs the question why. Do they take another objective? Do they lose a team fight? Statistics won’t ever tell you this alone. Watch a game.
It is also easy to fall into the trap of allowing your hypothesis (your initial idea of a player/team that is not properly evidenced) to make correlations in places they don’t exist. The funniest example of this is when I hear stories about Pro’s saying “I was right because I did *this particular action* because of *this particular reason*” despite the event not working out in their favour (be it builds, trading etc). The action you took in this particular case wasn’t necessarily wrong, but you didn’t account for enough things in the game that were happening at the time that you could have known about to make a better decision. When it comes to any analysis you do, you need to ensure that you account for all of the variable that may affect a particular judgement you choose to make. For example, statistically the ROX Tigers are poor warders.
Analyst 1: Does this mean they have poor vision?
Analyst 2: No. They just have low vision. Low is different to poor.
A1: Are they bad warders?
A2: Depends. Do they see everything they need to?
A1: I don’t know, I’m only looking at the statistics.
A2: Where are their wards placed?
A1: Not sure. Im only looking at the Statistics.
So the summation that the Tigers are “bad warders” seems premature already. It’s interesting that their warding habits are low when they create so much pressure from the Fog of War. It requires further investigation. I’ve done so previously, and I can safely say that up until this point, they ward to know where the enemy Jungler either has been, or was. It’s a calculated decision to say where they are headed next, or have just been, and make decisions on the map. This is not something statistics alone will tell you. Make sure that when you use statistics to make an evaluation, you account for the variables that may affect that statistic that could change your original premise. Personally, I don’t approach anything with preconceptions, because they are usually misconceptions. Create your own learning.
Map Side Wins (previous to weekend ending 13/3)
The last set of statistics I want to look at are the NALCS map side wins as a percentage of games played. Interestingly, I want to look at the first place side, a mid placed side, and the bottom team.
Immortals – according to this table, they have won a 93% of their games, and there is no huge difference between Blue (86%) and Red (100%). Renegades win 14% of their games, with their only wins coming on Blue (29%). When it comes to the IMT record, its safe to say that they have a strong strategy that accounts for both sides of the map. While there is the in-game strategy to consider, this also accounts for the Pick Ban (PB) strategy. They have only lost 1 game, and that was on Blue. On Blue in PB, they get to first pick after bans. So how/where did they loose it? (Consider they have had extremely strong performances all split).
Their PB wasn’t particularly different from anything we have seen in the past, except that a Kog ban came through against Turtle. No picks seemed out of place for any player, however this combination of champions hadn’t been combined. They beat CLG in the past, but this combination of champions was new. Particularly the Fiora/Udyr. As the game plays out, Huni is caught out – consistently. The Quinn is a great counter to Fiora, but against an Udyr who can move super quickly and stun (read, dive hard), negates that advantage. Huni was caught out this game. It allowed CLG to pressure the map. Turtle came up massive though. He put IMT into a position to win, but Xmithe’s Udyr continued to cause problems, stealing the Baron and Darshan pushing his Fiora into the base to win. IMT with one less effective champion (in Huni’s Quinn) and a far ahead Fiora and Udyr, pushes overall advantage into CLG’s hands. Still, the win only came through plays made at the end rather than a consistent and clinical win from CLG. Its called an outlier – IMT’s games are usually put to bed early, and they cycle through their positioning, calls, rotations and objectives to consistently take away the oppositions chance to come back into contention to win the game. Essentially IMT lost on a 50-50 play. Not detrimental to their Spring Split campaign. Note that Huni hasn’t played Quinn since. This makes the argument that IMT are strong on both sides of the map despite their loss.
Renegades. Their wins have come at the start of the season (game 1 V TL) and against DIG recently (and I just read, but haven’t accounted for as it was played earlier today, TSM :D). Game 1 of the season doesn’t say much about anything, so it’s considered to not be of much value for any team (think about TL now) – also considering that since then, there have been lots and lots of player movements. Picks and Bans are hard to judge based on changes in roster, because you don’t know what priorities REN will place on which positions when banning or picking. Freeze is a respected ADC (past performances), so he is always going to have a ban against him. REN have played plenty of long games, of which many could have gone either way. Some of which have been lost on a 50 50 play. Their DIG win came on a back door. Definitely not something that you plan for. Disregarding their 1 C9 stomp, Renegades have had consistent performances across both sides of the map, and while they have lost overall, there are aspects of their performances that show that they do not favour one side of the map.
We can see this trait across most of the NA LCS, and probably into every single region. It is interesting to see tendencies for win/loss on map sides, but you need to further explore how teams have won and lost to properly work out if teams favour a side. You will need to look at power spikes, jungle tendencies, lane tendencies (push, trade, swap, kill, passive, aggressive, zoning, tower pressure, farm heavy etc), objective priority, game length and the reason for that length, and even team comp and PB to start with. There is no simple answer, and we can see how deceiving statistics can be when it comes to our Win %age per side.
But even this can be flawed – I was aware of this however. It’s flawed, because NA is a region whereby so many in game outcomes go one way or the other that decide a number of games a weekend. How many times have we seen a team in front for so long so consistently, they make a bad decision or a team fight goes awry, lose a game? In Korea (where I watch with the most interest) it is almost boring because teams cycle through each and every objective that coincides with their win condition to win a game out. Teams are also acutely aware of what their loosing conditions are, and they play around them. They are great at not allowing teams to challenge their own win conditions, and find ways to take their own win conditions when possible. When games don’t go this way, they are excellent to watch because players and teams are great at finding another way to do something, or can pull out a flashier play to gain an advantage – imagine watching excellent boxers sparring with their best punches and defences all of the time. In a region like Korea, there may be a greater disparity between one side of the map and the other. However, there may not be. Much of League of Legends is based around 50-50 decisions that can go one way or the other to decide a game.
In Summary
Analysis of any sport requires knowledge of both statistics and in game performance. They rely on each other for creating holistic knowledge about a particular event – be it a game, team, or player. Fantasy Sports and Fantasy eSports (damn it Thorin) require players to account for both in game performances and performances against opposition. For example, a particular Mid-Laner may be a bad pick this weekend because you know he is focused by the opposition team, but regularly he creates great scores for you. Do this, but on a deeper level if you want to analyse League games.
Statistical Analysis for the sake of analysing statistics doesn’t tell us enough about anything other than what the statistics tell you. It doesn’t account for the player inside the team and against their opposition. Moreover, it doesn’t account for the Why of the Analysis. As I have explained above, the Why is paramount for building knowledge and properly explaining why a player does particular things with their team. Its great to know that a player might have particular tendencies, but you need to explain why. Otherwise, you could certainly be wrong as you haven’t accounted for any chance of deviation. If a team has particular tendencies, you need to explain why to account for the performance of its players and why particular decisions were made, or what their outcome was and their subsequent decisions (stalling for late game for example).
I have written this because I want to create stronger, evidence based knowledge in this community. I want to help to create better games and better understanding of how the game can be played to help advance the approach that is taken to the game. I don’t think for a second I’m giving anyone any answers or that I am changing the world. I do want to help support and create better analysis and stop people wasting time looking at statistics and only statistics for the sake of doing analysis.


Published: Mar 14, 2016 05:25 am